
Multispectral imagery set within New Jersey coastal context.

A diagram depicting a sampling of the wavelengths detected by Landsat 8’s band ranges. By mixing different combinations of bands, a material’s unique reflectance ‘signature’ can be calculated and classified.

Image comparing existing landcover data (NLCD) and custom high-resolution wetland landcover data created by using UAV multispectral imaging.

The position and area of land/ water changes depending on the water detection method. This image compares the outcomes of three of the most widely used indices: mNDWI; TCW; and NDVI.

Composite image comparing the land/ water boundaries of five different water detection indices.

Existing wetland datasets are woefully insufficient for accurate modeling of vulnerable coastal conditions. This set of images shows the difference in a model created with NLCD (top) and site-collected data (bottom).

The application of different international landcover classification standards to the same image clearly demonstrates how the spatial and thematic structure of various classification systems frame our understanding of the landscape. A comparison among the legends shows similarities and differences in how land cover themes are defined.
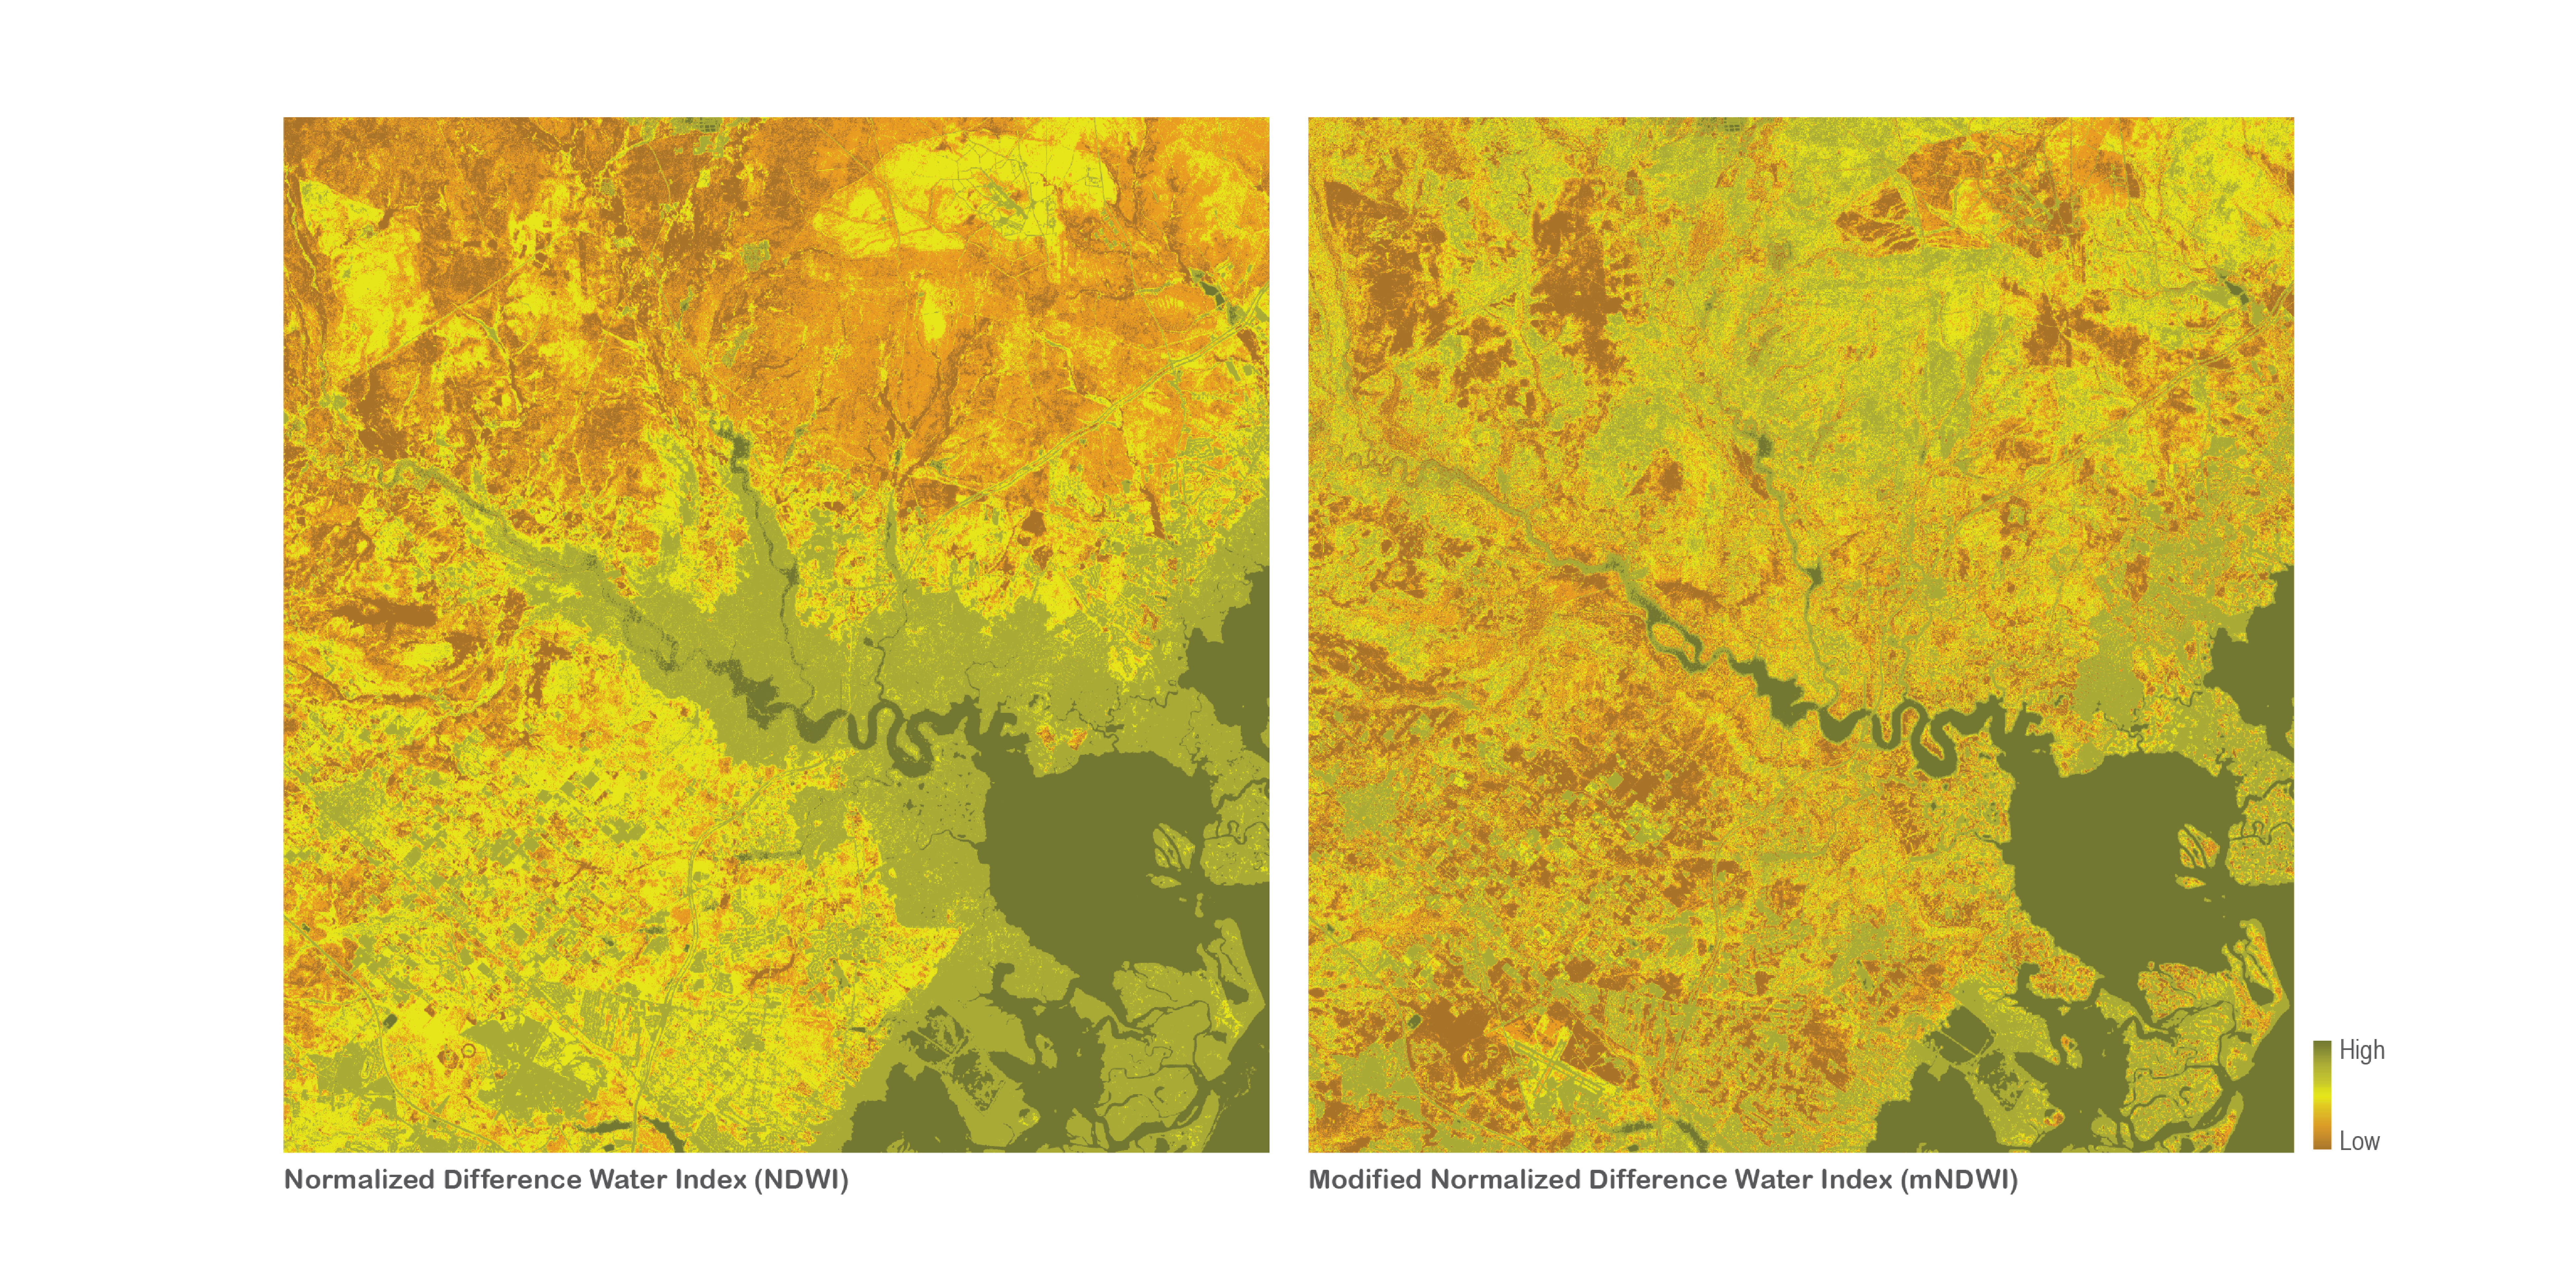
The region surrounding Great Bay, NJ. Rather than classifying an image using land cover themes, this image comparison shows moisture levels. The dark green color depicts areas of highest moisture while the dark brown represents the lowest. The use of different indices results in very different images, which could lead to different interpretations of this landscape.
Land Ahoy!
“Finding” water is a key step in most land cover datasets. Making material distinctions using multispectral imagery involves a great deal of interpretation as it is dependent on the detection index, satellite schedule, and tidal variation. This series of images shows different boundary locations between land and water depending on which classification method is used.
Led By: Karen M’Closkey and Keith VanDerSys
© 2020 University of Pennsylvania Stuart Weitzman School of Design
© The Ian L. McHarg Center for Urbanism and Ecology
210 South 34th Street
Philadelphia, PA 19104
© 2020 University of Pennsylvania Stuart Weitzman School of Design
© The Ian L. McHarg Center for Urbanism and Ecology
Office of the Director
210 South 34th Street
Philadelphia, PA 19104